Frontend
Summary
The front-end of this project consists in a web interface which users can use to access to thier vulnerabilities reports. They can also see on it all about their hosts, the listening services and open ports and, of course, all associated vulnerabilities.
To make this interface, we did only use HTML, JS and CSS files. All dependencies like stylesheets, source of JS libraries are downloaded locally to make sure that if the Cegabox is offline you can still use a nice interface.
All data displayed on the web interface comes from our API which make all requests to the database.
How to use the web interface ?
Create an account
First of all, to access the reports, you will need an account. To create it, go to the local website of your Cegabox and click on “Create an account”.
Then, when your account is created, you could connect and see the dashboard with main informations on it. Good to know, your account always start with “Reader” privileges, if you want to change yours, contact the administrator or if you are the administrator, see our page Administrate your Cegabox.
Dashboard
When you connect, you will always go to this page, it’s the main page.
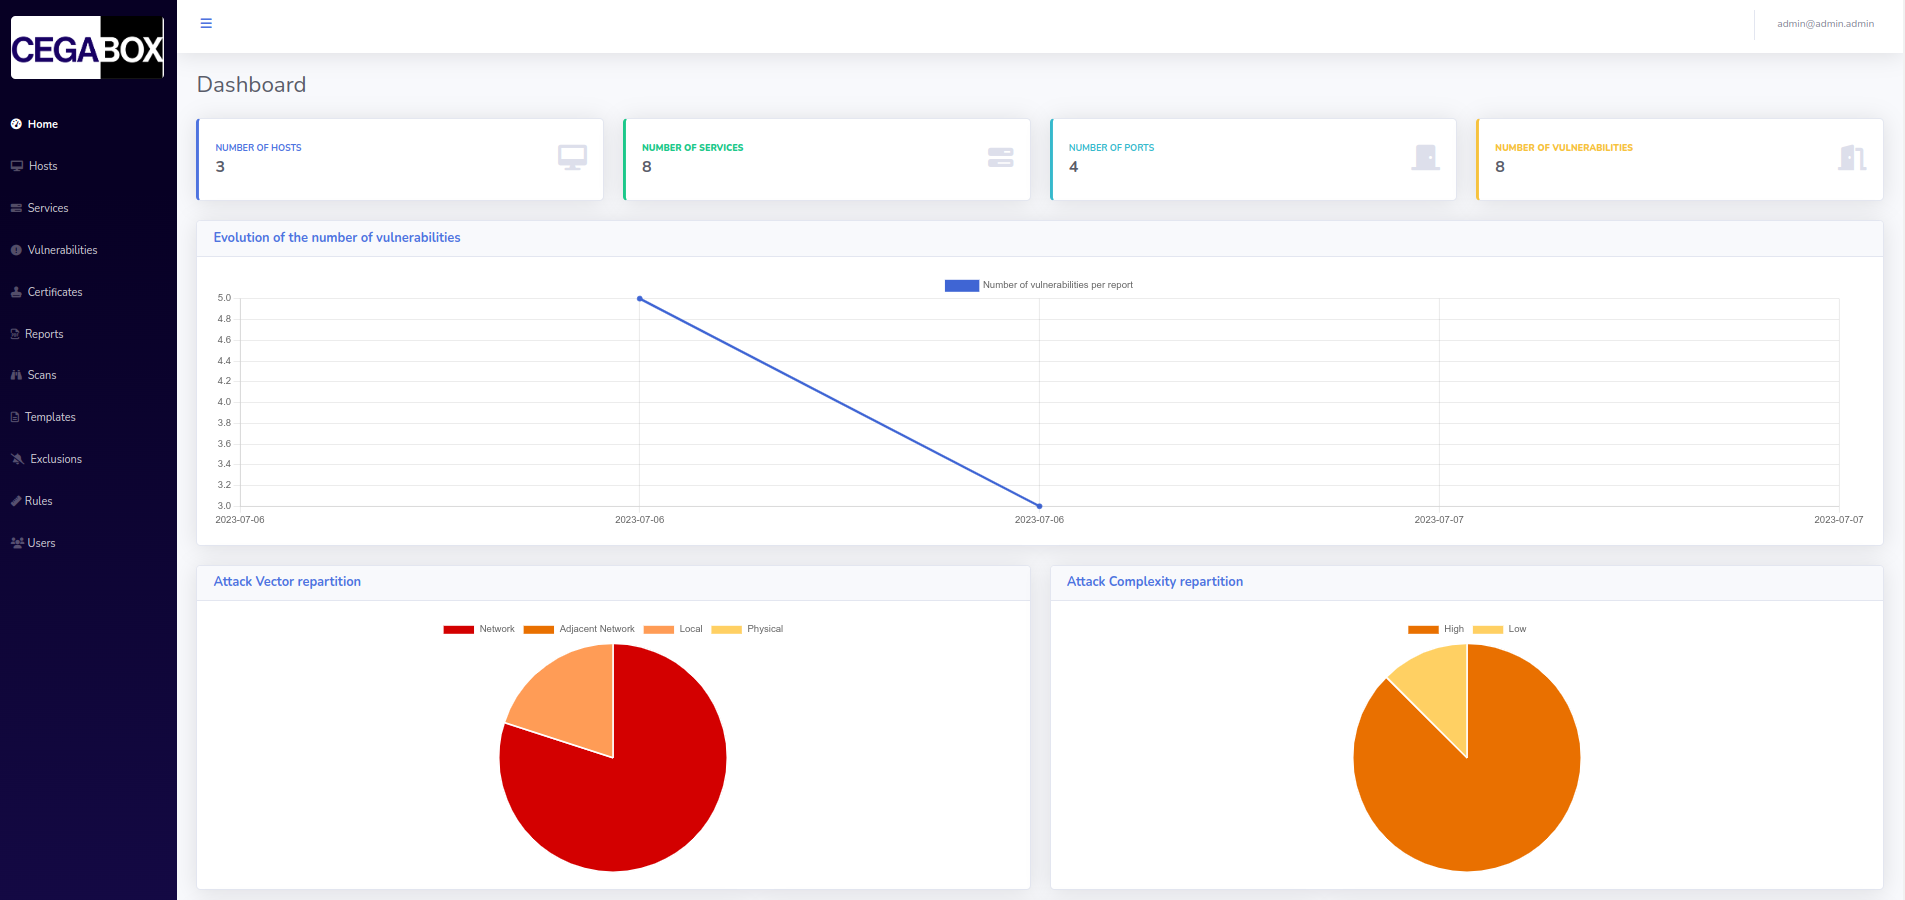
In the right corner, you can see your account and view with which account you are currently connected.
Top cards
In the four little top cards, you can see a resume of what have been found on your network, with the number of hosts, services, ports and vulnerabilities.

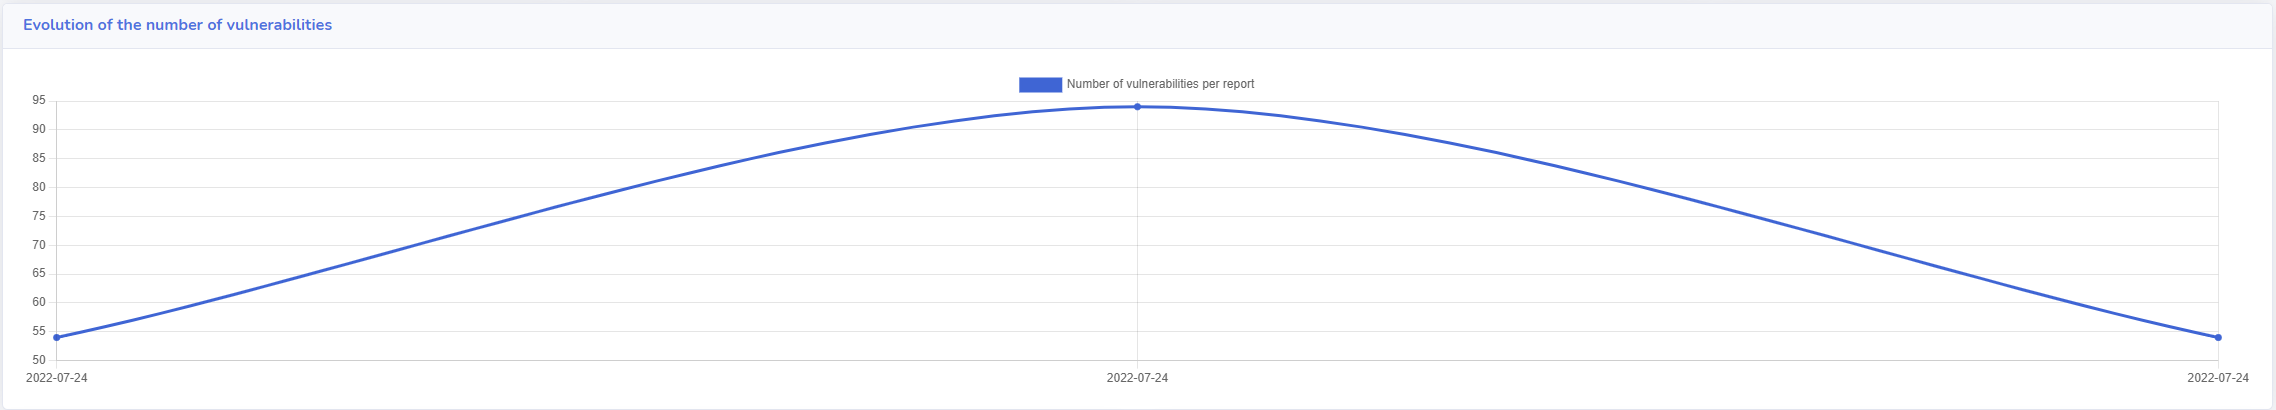
Evolution
With this chart, you can see the trends of your vulnerabilities inside multiple reports. The best design is a downing one which means you have less and less vulnerabilities.
Repartitions
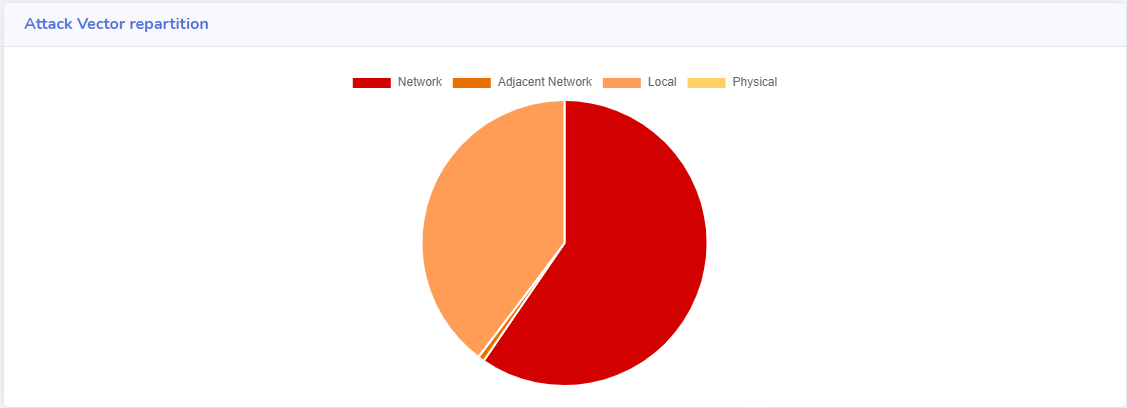
Attack Vector
With this chart, you should see the repartition within the 4 main attack vectors, which are:
- Network
- Adjacent Network
- Local
- Physical
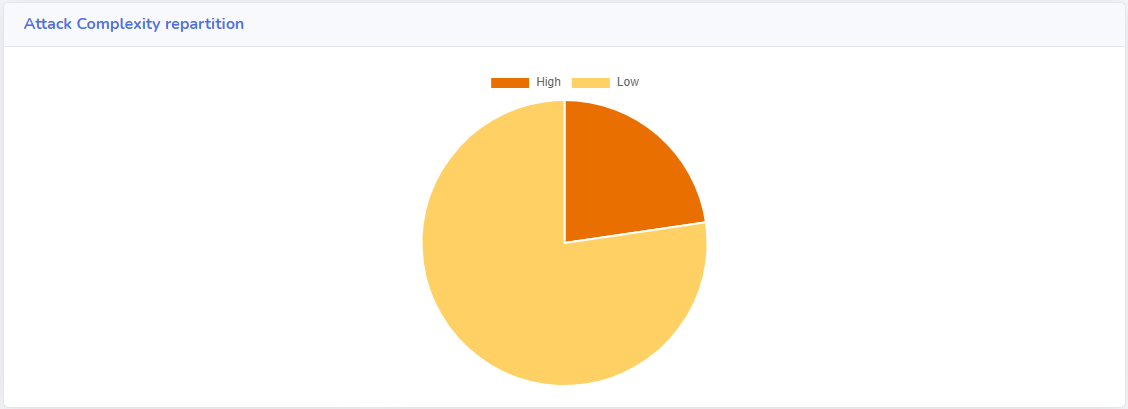
Attack Complexity
With this chart, you should see the repartition for the attack complexity, which could be:
- High
- Low
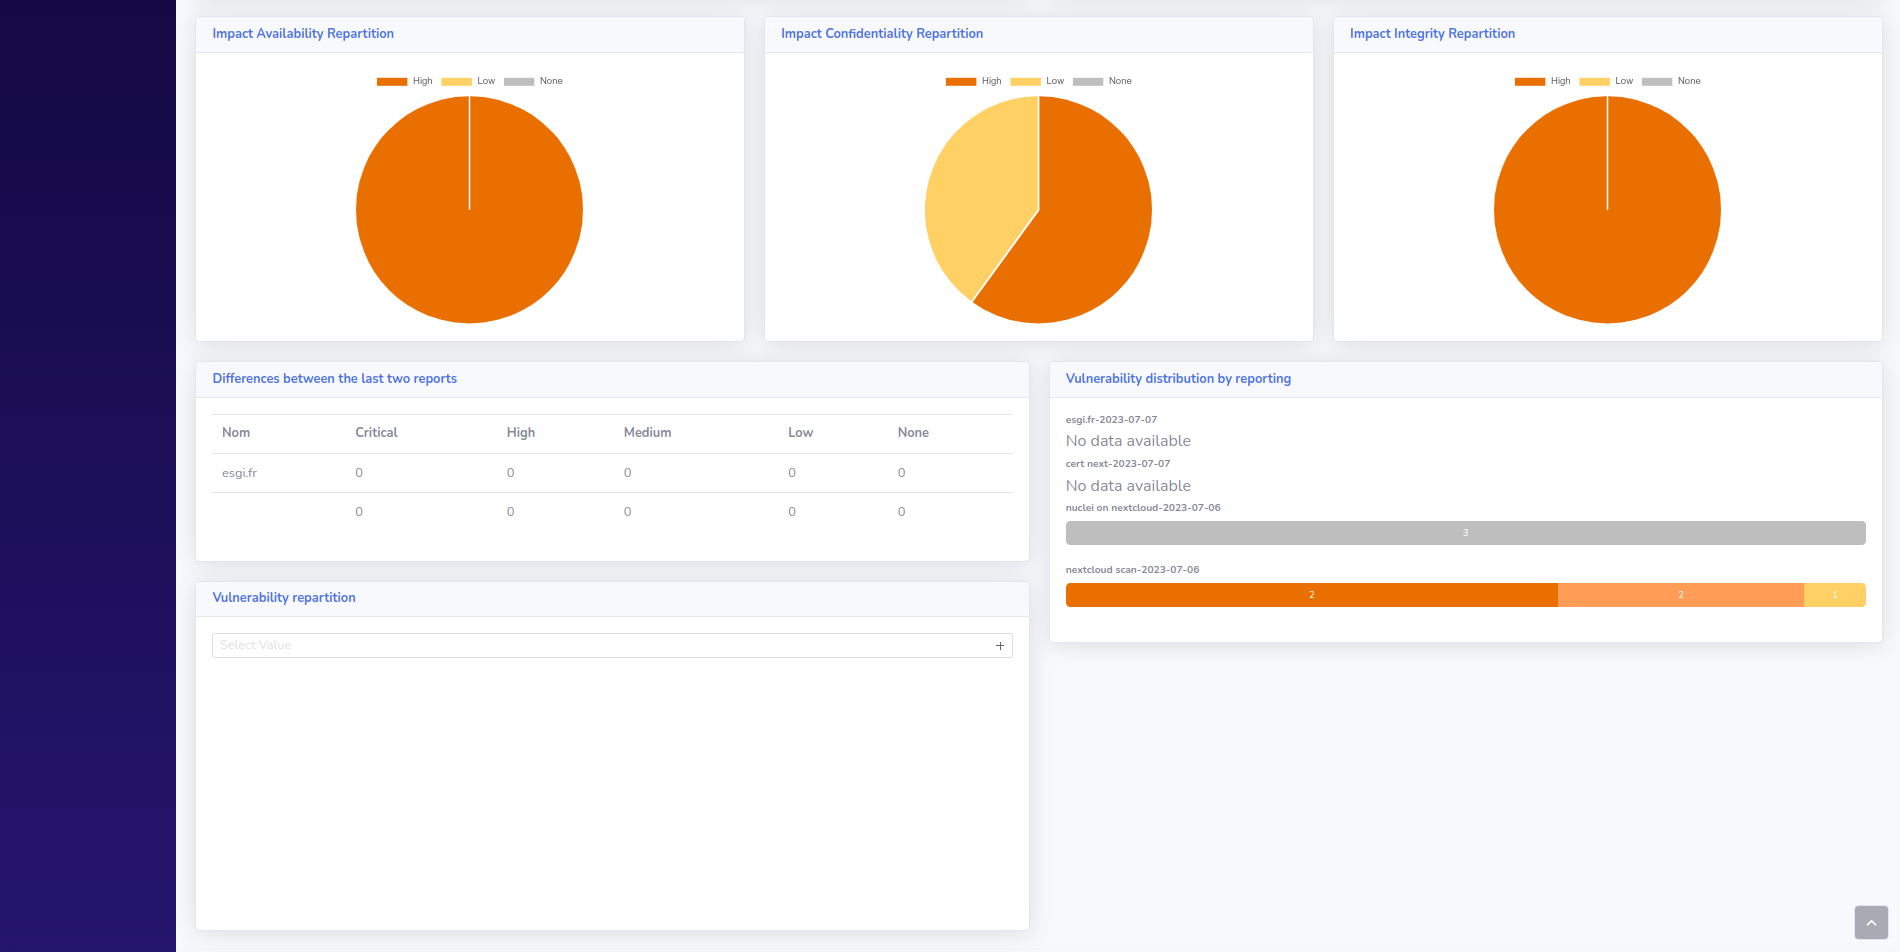
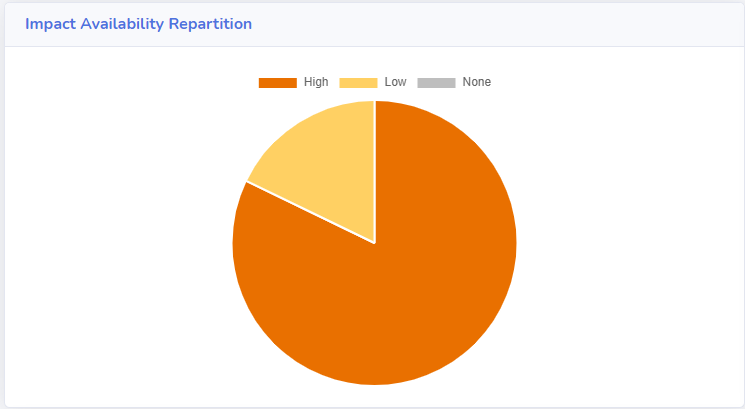
Impact Availability
With this chart, you should see the repartition for the availability impact, which could be:
- High
- Low
- None
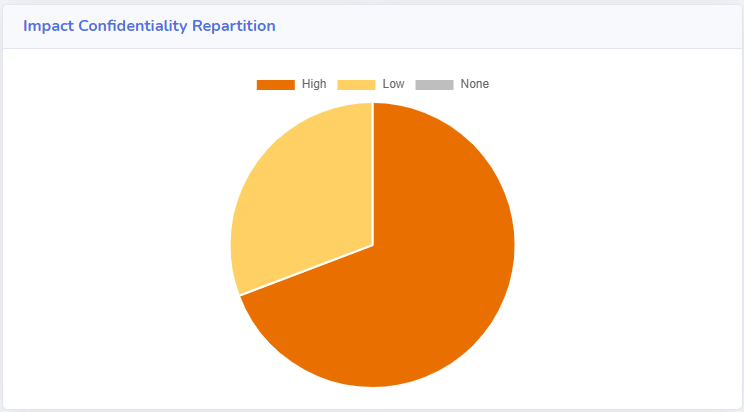
Impact Confidentiality
With this chart, you should see the repartition for the confidentiality impact, which could be:
- High
- Low
- None
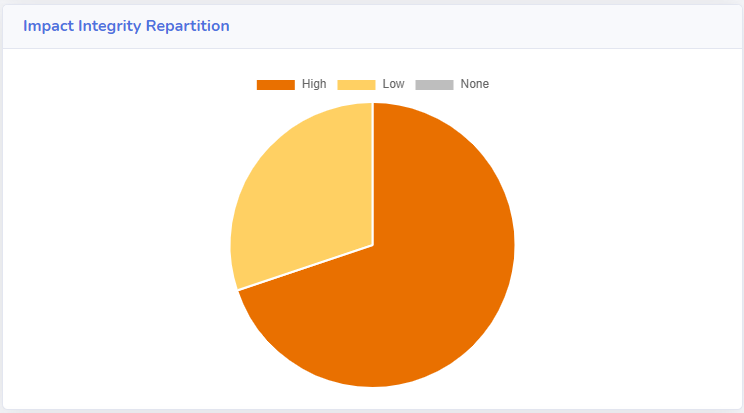
Impact Integrity
With this chart, you should see the repartition for the integrity impact, which could be:
- High
- Low
- None
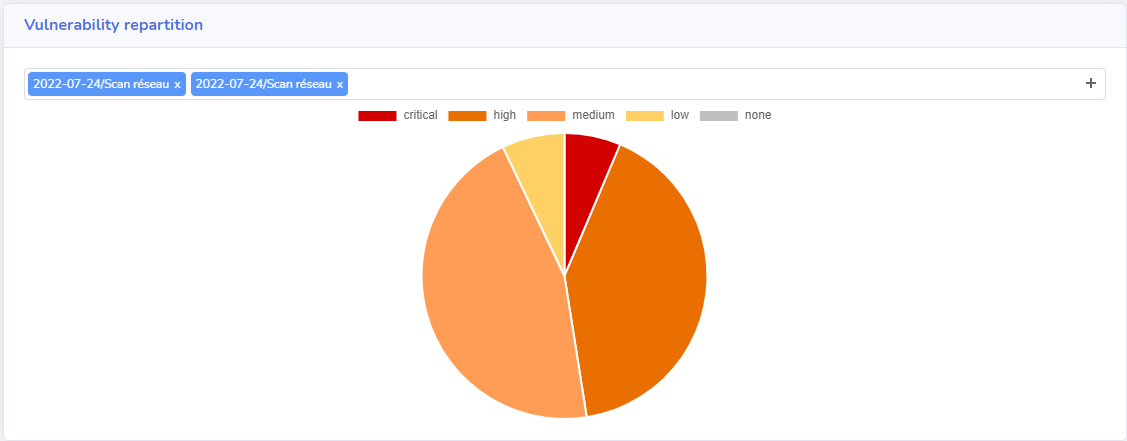
Vulnerabilities
With this chart, you could select all reports on which you want to see a vulnerability criticity repartition.
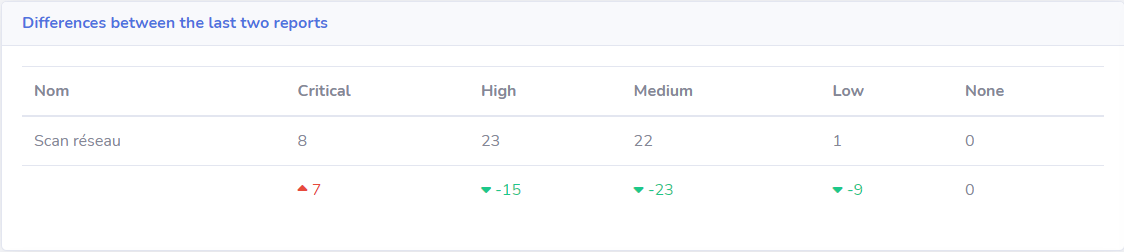
Differences
This section has the purpose to show you the difference between your two last reports. It will highlights you a colored difference which helps you to understand easily which type of vulnerabilities you have reduce, increase or do not change.
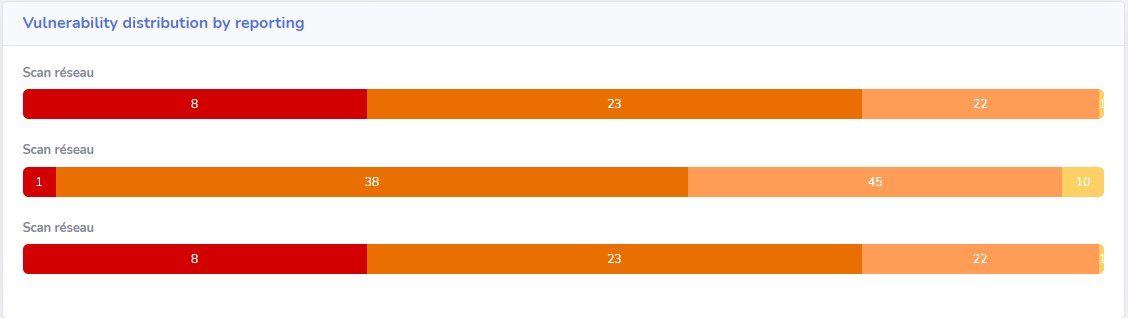
Vulnerability Distribution
This section shows you the distributions of your vulnerabilities for all your reports. The reports are reverse order to make sure that the latest one is displayed on top. For each report, we have ponderate it by making this simple rule:
- Criticity critical: 16 points
- Criticity high: 8 points
- Criticity medium: 4 points
- Criticity low: 2 points
- Criticity none: 1 point